How to Use Heatmaps and Session Replay to Analyze User Behavior
Uncovering hidden insights to improve conversions and sales
Understanding how users interact with your website is critical for increasing conversions and sales. Traditional analytics tell you what users do (bounce rates, clicks, conversions), but not why. That’s where heatmaps and session replay come in. These tools provide visual, behavioral insights that reveal hidden friction points and optimization opportunities. In this article, we’ll explore how heatmaps and session recordings work, real-world examples of their impact, and practical tips for using them in e-commerce.
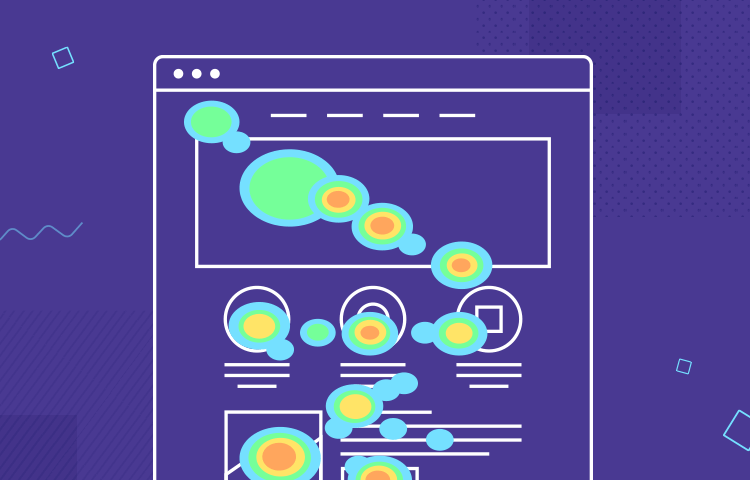
Heatmaps are visual representations of where users click, scroll, or move their cursor on a webpage. They use color coding (red = high activity, blue = low activity) to show which elements attract the most attention.
Types of heatmaps:
- Click Heatmaps: Show where users click the most, revealing CTA effectiveness.
- Scroll Heatmaps: Indicate how far down the page users scroll—critical for long product pages or blogs.
- Move Heatmaps: Track cursor movements, often reflecting eye movement patterns.
Example: An online clothing store discovered that users were clicking on product images expecting a zoom feature. By adding zoom functionality, they increased conversions by 17%.
Session replay tools record real user sessions, allowing you to watch replays of how customers navigate your site—clicks, scrolls, form interactions, and even hesitations. Unlike aggregated data, session replays show individual experiences in real time.
Example: A SaaS company used session replay to identify that users were abandoning signup because of a confusing form field. After simplifying the form, signups increased by 28%.
Heatmaps and session replay reveal critical conversion insights that analytics alone can’t provide:
- Identify dead zones where users ignore elements.
- Discover rage clicks on broken or confusing buttons.
- See exactly where users abandon the checkout process.
- Understand mobile vs desktop behavior differences.
- Case A: An electronics store found that users never scrolled past half the homepage. By moving promotions higher, they increased clicks on featured products by 35%.
- Case B: A subscription service reduced checkout abandonment by 22% after heatmaps revealed users were missing the “Apply Discount” field hidden below the fold.
- Case C: A travel booking site improved form completion rates by 18% after session replay showed users getting stuck on date picker controls.
Popular tools include Hotjar, Crazy Egg, Microsoft Clarity, and FullStory. These can be integrated into your e-commerce site in minutes, with dashboards that visualize user behavior.
- Start with Key Pages: Focus on product pages, cart, and checkout first.
- Run A/B Tests: Combine insights with experiments to validate changes.
- Segment by Device: Compare mobile vs desktop behavior for hidden issues.
- Look for Friction Points: Identify hesitation, rage clicks, or abandoned interactions.
Search engines reward good user experience. If heatmaps show that users leave quickly (high bounce), it signals poor relevance or usability, which can hurt rankings. Improving UI based on these insights reduces bounce rate, increases dwell time, and indirectly boosts SEO performance.
Example: A site that improves mobile button placement not only increases conversions but also reduces pogo-sticking (back-and-forth clicks in search results), which search engines view negatively.
- ✅ Install heatmap/session replay tools on key funnel pages.
- ✅ Review recordings weekly to identify recurring friction points.
- ✅ Prioritize fixes that affect checkout and product discovery.
- ✅ Segment results by device and traffic source for accuracy.
- ✅ Document insights and feed them into your UI/UX roadmap.
Heatmaps and session replay bridge the gap between analytics and real user experience. They show you not just the numbers, but the stories behind them—why customers click, where they hesitate, and where they drop off. By acting on these insights, e-commerce businesses can unlock significant growth through smarter UI/UX design and optimized sales funnels.
Manually analyzing user behavior takes time. SalesPilot is an advanced seo extension that integrates behavior insights with SEO and sales metrics. Monitor Core Web Vitals, heatmap patterns, and checkout performance in one place—and let AI show you where to improve.
Free Chrome extension • Behavior analytics • Increase conversions with data-driven insights